Fine-Tuned Forecasts: Northwest Avalanche Center Launches New Website
Story by Kate Hourihan / photos courtesy of NWAC
Between all 20 Avalanche Centers in the U.S., and many others worldwide, no two organizations deliver a daily avalanche forecast in exactly the same way. While there are many overlaps in language, iconography and general structure, each avalanche center ultimately has its own format. And because of this, as research evolves in understanding how to best to keep people safe from avalanche danger, avalanche centers have the ability to fine-tune how information is delivered to users through forecasts.
In December 2013, the Northwest Avalanche Center (NWAC) launched a new website. In addition to a visual face-lift, new mobile capabilities, and a more user-friendly interface, significant changes were made to how the daily avalanche forecast is broken down and presented to users. The re-design was influenced greatly by the Colorado Avalanche and Information Center (CAIC), whose design most closely resembles NWAC’s and relies on may principles originally defined by the Canadian Avalanche Center (CAC).
NWAC had specific intentions behind the re-design. The main goal, explains Program Director Scott Schell, was to create targeted forecasts applicable to various user types in order to reach everyone who might use the site—from “newcomers to the backcountry with little or no formalized avy education, to outdoor professionals and everyone in between.”
While the previous approach used a one-page forecast to explain many layers of weather and risk complexity, this new site structure aims to organize the various chunks of forecast information intentionally. Thus it uses the following tiered navigation tabs as a guide:
The intent is to provide a clear, straightforward forecast for those who have not had much weather and avalanche training, while still providing experienced backcountry travelers the detailed forecasts they’re used to seeing and interpreting. The third tab/tier of information relays the weather station telemetry and field observations, supplying the most advanced backcountry users with the ability to analyze and interpret raw data on their own.
In this way, a novice user can get a clear sense of the avalanche danger and general concerns without feeling alienated by advanced terminology, or worse, misinterpreting details they don’t understand.
Another significant change comes in how the forecast is broken down based on aspect and elevation. Schell explains that the “Danger Rose” used previously by NWAC “consisted of four elevation bands and eight cardinal directions for a total of 32 pieces of the pie; each with one of five possible danger ratings.” But with that amount of complexity, he admits, “the Danger Rose conveys an accuracy that we may not possess.”
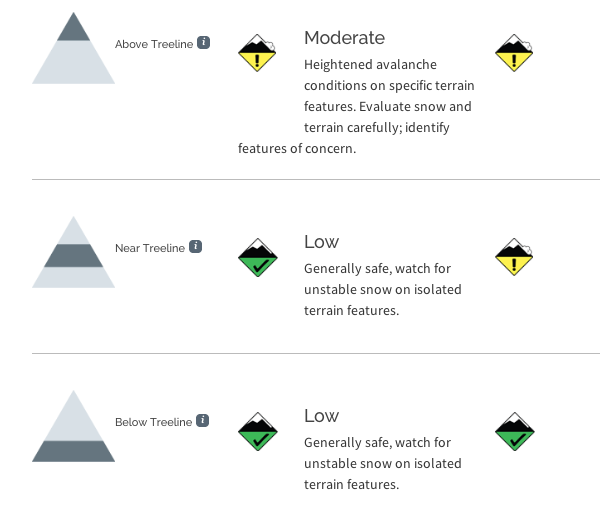
The new website uses, instead, a system of dividing information into greater and greater subtlety. Beginning with elevation zones defined by their respect to tree-line (as opposed to actual vertical feet), the site clearly offers users a reference point for the terrain through which they’ll be traveling. At each elevation band—Above tree-line, Near tree-line, and Below-tree line—viewers receive an overall risk rating, as well as travel advice for that zone. Schell explains: “The borders of these bands are not fixed elevations, but rather changes in vegetation which has its influence on the weather and therefore the snowpack.”
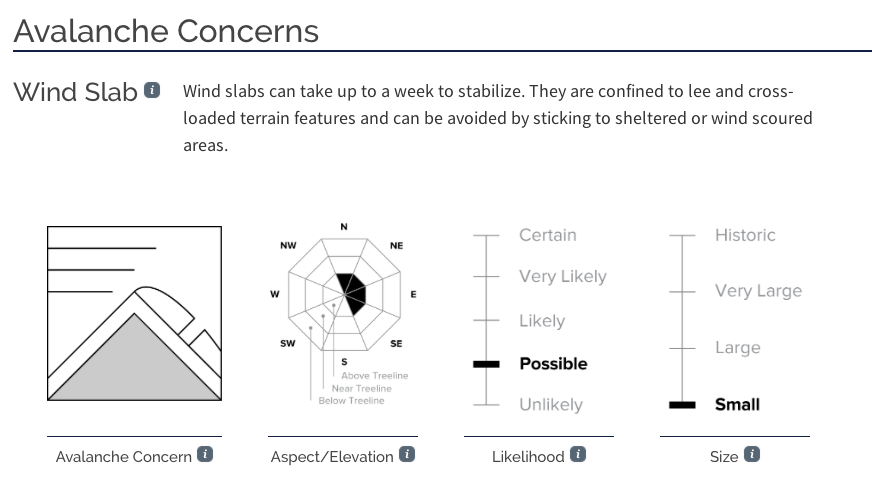
The second break down of information outlines the particular avalanche concerns that are present within the zones that show a risk. It also indicates their likelihood, size, and on which aspects they’re likely. This system allows users to realize hazards independent of one another. For example, you may have a small wind-slab problem on north through northeast aspects, but you want to also make sure that that you’re aware of a larger potential to trigger wet slides on south-facing slopes due to a rapid rise in temperature.
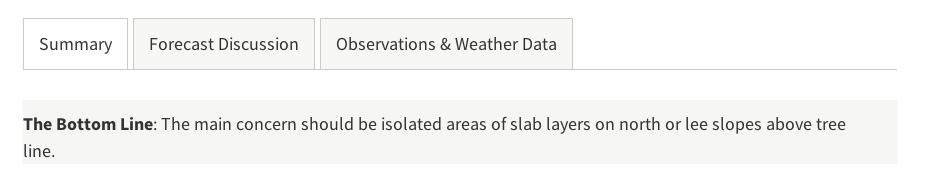
All of this aforementioned information is contained within the “Summary,” and is just the tip of the iceberg when it comes to avalanche forecast information available on NWAC’s site. More experienced users can still read detailed “Forecast Discussions” and access raw data if they want to dive that deep.
While the new layout may take some getting used to, especially if you were very familiar the Danger Rose, NWAC’s ultimate goal was to increase the understanding—and accuracy—of their forecast for all users.
The Northwest Avalanche Center relies on support of grants, individual donors and companies like MSR and its many other sponsors. As our local avalanche center, many MSR employees check NWAC’s reports daily during the winter and rely on the valuable information to plan each outing we take into the backcountry. We’re thrilled about the updates and hope you’ll find them useful too.
Kate Hourihan grew up outside Boston, Massachusetts and began her migration westward after college in 2007. She spent five years in Utah, initially as a ski bum in the Wasatch Mountains and eventually as a professional telemark skier. She currently lives in Seattle and hopes to balance a career as a writer and graphic designer with skiing, climbing and exploring the Cascades as much as she can.